Raster graphics, also known as bitmap graphics, form the bedrock of how we perceive and create images in the digital realm. Unlike their vector counterparts, which rely on mathematical equations, raster images are constructed from a meticulous arrangement of tiny, individual colored squares called pixels. This fundamental difference dictates their strengths, weaknesses, and best applications, making a thorough understanding of raster graphics essential for anyone involved in visual design, digital photography, or web development.
The Pixel as the Building Block
At its core, a raster graphic is a rectangular grid of pixels, a concept often illustrated by the humble smiley face icon. Each pixel, short for "picture element," represents a single point of color within the image. When viewed from a distance, these minuscule squares blend together to form a cohesive picture, much like the individual tiles in a mosaic create a larger, intricate artwork. The printing and prepress industries refer to raster graphics as "contone" (continuous tone) images, acknowledging their proficiency in rendering subtle color transitions.
The fundamental strategy underpinning the raster data model is the tessellation of a plane into a two-dimensional array of squares, each serving as a pixel. In digital photography, this plane is the visual field projected onto the image sensor; in computer art, it's a virtual canvas; and in geographic information systems (GIS), it represents a projection of the Earth's surface. For each pixel, a single numeric value is stored, most commonly representing a visible color. However, other measurements, such as qualitative categories or specific data points, are also possible.
The fidelity of colors represented by a raster image is determined by its "color depth," which dictates the number of bits devoted to each pixel. A higher color depth allows for a greater range of colors. Most modern color raster formats utilize 24 bits per pixel, allocating 8 bits for each of the red, green, and blue color channels. This provides over 16 million distinct colors, often referred to as "truecolor," capable of realistically depicting complex photographic imagery. The number of pixels in a display or image, known as its resolution, directly impacts the level of detail that can be depicted. Resolution is frequently expressed as the number of pixels in a column multiplied by the number of pixels in a row (e.g., 800 x 600).
The Origins and Evolution of Raster Graphics
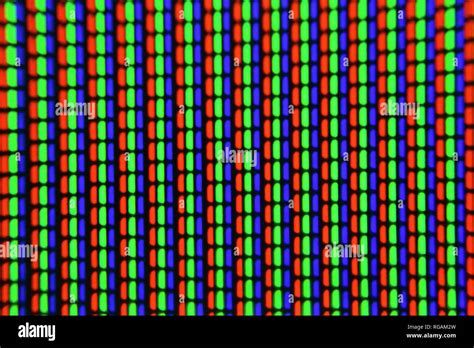
The concept of raster graphics has deep roots, tracing back to the early days of television technology. Mechanical televisions developed in the 1920s employed rasterization principles, and electronic televisions based on cathode-ray tube (CRT) displays drew images by scanning across the screen line by line, from left to right, and then moving from top to bottom. This "raster scan" is where the term "raster" originates, stemming from the Latin word "rastrum," meaning a rake, alluding to the sweeping motion. Even modern flat-panel displays, such as LED monitors, continue to utilize a raster approach, where each on-screen pixel directly corresponds to a small set of bits in memory. The screen is refreshed by systematically scanning through these pixels and coloring them according to the stored data.
Electronic Display Technology History 1922 - 2022
A significant development in the evolution of raster graphics was the invention of scanned displays by A. Michael Noll in the late 1960s. While pen plotters, utilizing vector graphics, were prevalent in the 1970s and 1980s for precise drawings, the widespread adoption of personal computers with improved graphics capabilities in the 1990s propelled raster graphics into mainstream use. Images captured by optical scanners and digital cameras, along with the vast majority of images found on the internet, are inherently raster-based.
Storing and Representing Raster Data
The data structure underlying a raster graphic is based on a two-dimensional array of cells (pixels). To store this information in a file, the two-dimensional array must be serialized, typically in a row-major format. This means the pixels of the first row are listed from left to right, followed by the pixels of the second row, and so on. To reconstruct the two-dimensional grid, a file header is essential. This header contains crucial information, such as the number of columns and the pixel data type (including the number of bits or bytes per value), enabling the reading software to understand where each pixel's data begins and ends.
The complexity and detail of raster images, particularly high-resolution photographs, can lead to substantial file sizes. This has driven the development of various data compression techniques. The most common strategy involves identifying patterns or trends in pixel values and storing a parameterized form of these patterns instead of the raw data. For example, Run-Length Encoding (RLE) is a lossless compression method that looks for repeated sequences of pixel values and replaces them with the value itself and the count of its repetitions. Other compression algorithms, such as LZW, are also lossless, meaning the original pixel data can be perfectly reconstructed from the compressed file.
Strengths and Limitations of Raster Graphics
Raster graphics excel in their ability to capture and display realistic imagery with intricate details and subtle color gradations. They are the ideal format for photographs, digital paintings, and scanned documents where fidelity to the original visual information is paramount. The ability to precisely edit individual pixels using raster-based image editors like Adobe Photoshop, GIMP, or Paint.NET offers granular control over the image's appearance, allowing for detailed retouching, color correction, and the application of complex artistic effects.
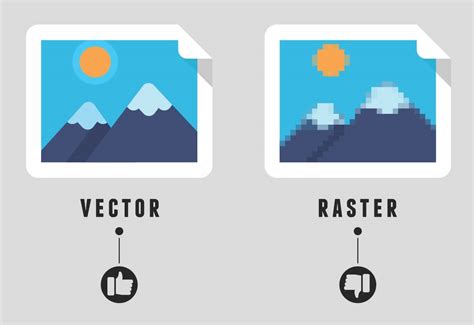
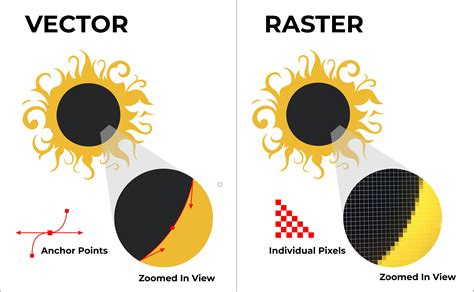
However, raster graphics are inherently "resolution-dependent." This means that their quality is tied to the number of pixels they contain. When a raster image is resized, particularly when enlarged, the individual pixels become more apparent, leading to a loss of sharpness, blurring, or "pixelation." This is because the software must either stretch the existing pixels or create new ones based on algorithms, neither of which can perfectly replicate the original detail. This limitation makes raster graphics less suitable for logos, typefaces, or other graphics that need to be scaled to various sizes without compromising quality. For such applications, vector graphics, which are based on mathematical formulas, offer superior scalability.
Another consideration is file size. While compression techniques help manage this, highly detailed raster images, especially at high resolutions, can still result in large files, impacting storage and loading times, particularly on the web. Furthermore, the distinct square pixels of raster images can sometimes present challenges in specific printing applications, such as fabric printing, where they may not translate as smoothly as vector-based designs.
Common Raster File Formats
Several file formats are commonly used for storing raster graphics, each with its own characteristics regarding compression, color support, and transparency:
- JPEG (Joint Photographic Experts Group): A widely used "lossy" format, meaning some image data is discarded during compression to achieve smaller file sizes. This makes JPEGs ideal for photographs on the web, where faster loading speeds are desirable, though it can lead to a noticeable drop in quality if compressed too aggressively.
- PNG (Portable Network Graphic): A "lossless" format that preserves all image data, resulting in higher quality than JPEG. PNGs are particularly useful for web graphics that require transparency (e.g., logos placed over different backgrounds) and for images with sharp lines or text.
- GIF (Graphics Interchange Format): An older "lossless" format that supports animation and transparency. However, GIF is limited to a palette of 256 colors, making it unsuitable for detailed photographs. It is primarily used for simple animations and graphics with limited color needs.
- BMP (Windows Bitmap): A "lossless" format that typically results in large file sizes as it stores a large amount of pixel data without significant compression. It is less common for web use due to its size.
- TIFF (Tagged Image File Format): A versatile "lossless" format often used in professional printing and publishing. It supports high color depths and can include layers and other image editing information, making it suitable for print production where maximum quality is required.
- EPS (Encapsulated PostScript): While often associated with vector graphics, EPS files can also contain raster images. They are frequently used in the pre-press industry.
The choice of file format depends heavily on the intended use of the image. For printing, lossless formats like TIFF are often preferred. For web display, a balance between quality and file size is key, with JPEG and PNG being the most common choices.
Raster Graphics in Practice
The pervasive nature of raster graphics is evident in numerous applications. Digital photography, by its very nature, captures images as raster data. When you take a selfie with your phone or import photos from a digital camera, you are working with raster images. The internet is teeming with raster graphics, from the images on your favorite websites to the memes you share on social media.
In Geographic Information Systems (GIS), raster grids are fundamental for representing spatial data. Each cell in a georeferenced raster grid represents a specific geographic area, with its value indicating a particular property like temperature, population density, land cover, or elevation. This allows for sophisticated spatial analysis and visualization of environmental and demographic information.
Even in areas like video games and medical imaging devices (such as MRI scanners), three-dimensional raster graphics play a crucial role in rendering complex visual environments and detailed anatomical representations.
Optimizing and Editing Raster Images
For digital marketing and design, optimizing raster graphics is a critical step to ensure a positive user experience. This involves techniques such as:
- Compression: Reducing file size without significant loss of visual quality, crucial for faster website loading times.
- Choosing the Right Format: Selecting JPEG for photographs, PNG for images with transparency, and GIF for simple animations.
- Responsive Design: Ensuring that raster images display correctly and maintain their quality across various devices and screen sizes.
When editing raster images, software like Adobe Photoshop offers a vast array of tools to manipulate individual pixels. This allows for precise adjustments to color, tone, and detail. However, it's important to remember the resolution-dependent nature of these images. While editing, maintaining an awareness of the image's original resolution and its intended output is vital to avoid undesirable pixelation when resizing.
Conclusion
Raster graphics, with their pixel-based structure, are indispensable for capturing and displaying the rich detail and continuous tones of the real world, making them the go-to format for photographs and complex digital artwork. While their resolution dependency presents challenges when scaling, their versatility, ease of editing, and widespread support make them a cornerstone of digital imaging. Understanding the nuances of raster graphics, from the fundamental pixel to the intricacies of file formats and optimization, empowers creators and consumers alike to effectively utilize and appreciate the visual content that surrounds us.