The correlation coefficient is a fundamental statistical tool used to quantify the strength and direction of a linear relationship between two variables. It provides a numerical summary, ranging from -1 to +1, that helps us understand how closely two datasets move together. This concept is widely applied across various disciplines, from scientific research and social sciences to finance and biology, offering insights into the interconnectedness of phenomena.
What is a Correlation Coefficient?
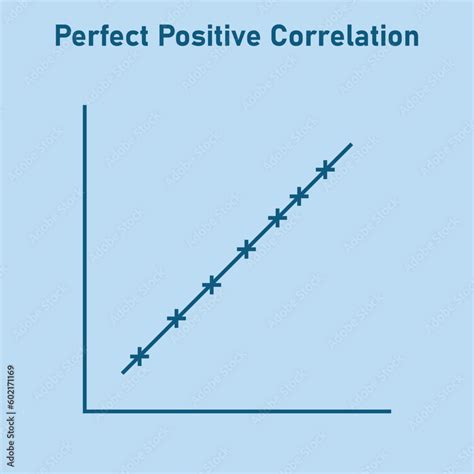
At its core, a correlation coefficient is a measure of association. It tells us not only if two variables are related but also how strongly they are related. A correlation coefficient of 1 signifies a perfect positive linear relationship, meaning that as one variable increases, the other increases proportionally. Conversely, a correlation coefficient of -1 indicates a perfect negative linear relationship, where an increase in one variable is met with a proportional decrease in the other. A coefficient of 0 suggests no linear relationship between the variables; changes in one do not predict changes in the other in a linear fashion.
The absolute value of the correlation coefficient is crucial for understanding the strength of the relationship. A larger absolute value, regardless of its sign, denotes a stronger association. For instance, a correlation coefficient of -0.75 represents a stronger linear relationship than a coefficient of 0.65 because the absolute value of -0.75 is 0.75, which is greater than 0.65. However, what constitutes a "meaningful" correlation can vary significantly depending on the specific field of study and the context of the research.
Pearson's Correlation: The Most Popular Choice
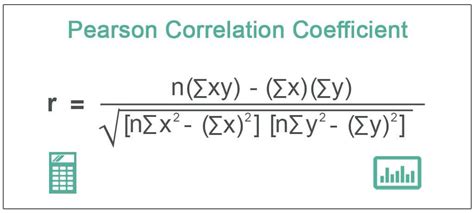
Among the various types of correlation coefficients, Pearson's correlation, often denoted as Pearson's R or Pearson's product-moment correlation coefficient (PPMC), is the most widely recognized and frequently used, especially in introductory statistics and linear regression. It is particularly effective when assessing the strength and direction of a linear relationship between two continuous variables.
Pearson's R is defined as the covariance of the two variables divided by the product of their standard deviations. This calculation essentially measures how much two variables vary together relative to how much they vary individually.
The PPMC is a parametric test, which means it assumes certain characteristics about the data, such as normality and linearity. It is best suited for data that exhibits a roughly linear pattern when plotted. Before calculating Pearson's R, it is highly recommended to create a scatter plot of the data. If the data points form a pattern that approximates a straight line, then Pearson's R is likely an appropriate measure. If the data shows a clear curve or has significant outliers, other correlation measures might be more suitable.
Calculating Pearson's Correlation
While the underlying formula for Pearson's R can be complex, statistical software and calculators can compute it efficiently. The general steps involve:
- Data Preparation: Organize your data into two columns, representing the two variables.
- Scatter Plot: Create a scatter plot to visually assess the linearity of the relationship.
- Calculation: Use statistical software (like Excel, SPSS, or Minitab) or a graphing calculator to compute the correlation coefficient.
For example, in Excel, one can use the CORREL function, specifying the ranges of the two datasets. In SPSS, the "Bivariate Correlations" option under the "Analyze" menu allows for the calculation of Pearson's R.
Other Types of Correlation Coefficients
While Pearson's R is dominant, several other correlation coefficients exist, each designed for specific data types and relationship patterns:
Spearman's Rank Correlation (Spearman's Rho, ρ or rs): This non-parametric coefficient is used when the assumptions of Pearson's R are not met. It measures the strength and direction of a monotonic relationship, which means variables tend to move in the same or opposite direction, but not necessarily at a constant rate. Spearman's Rho is calculated based on the ranks of the data rather than their raw values, making it robust to outliers and suitable for ordinal data. A value of 1 means all rankings match perfectly, while -1 indicates the rankings are exactly opposite.
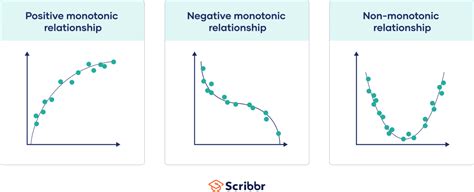
Kendall's Tau (τ): Another non-parametric measure, Kendall's Tau also assesses the strength and direction of a monotonic relationship. It works by comparing the number of concordant pairs (pairs that are ranked in the same order) to the number of discordant pairs (pairs ranked in opposite orders). It is often preferred for smaller datasets or when dealing with ties in ranks.
Intraclass Correlation (ICC): This coefficient evaluates the consistency or agreement of ratings or measurements within clusters of data. It is particularly useful for assessing inter-rater reliability when multiple raters or measurements are involved, offering a more comprehensive assessment than Pearson's R in such scenarios.
Matthews Correlation Coefficient (MCC): The MCC is specifically designed for evaluating binary classification models. It considers true positives, true negatives, false positives, and false negatives, providing a balanced measure of classification accuracy, especially in imbalanced datasets. It ranges from -1 (perfect disagreement) to +1 (perfect agreement).
Moran's I: This coefficient measures spatial autocorrelation, indicating the degree to which similar values are clustered together in geographic space. It is essential in spatial statistics to detect patterns and understand the dependency of observations based on their proximity. Moran's I ranges from -1 (perfect dispersion) to +1 (perfect clustering).
Phi Coefficient (φ): Used for assessing the association between two binary (dichotomous) variables, the Phi coefficient is particularly useful for 2x2 contingency tables. It's also known as the Yule phi or Mean Square Contingency Coefficient.
Point Biserial Correlation (rpbi): A special case of Pearson's r, used when one variable is dichotomous (e.g., yes/no, male/female) and the other is continuous.
Polychoric Correlation: Measures the association between two ordered-categorical variables, assuming an underlying continuous bivariate distribution.
Tetrachoric Correlation: Similar to polychoric, but specifically for two dichotomous variables that are assumed to be underlying continuous variables. It indicates the strength of association between ratings from two raters.
Cramer's V: This measure is used to assess the strength of association between two nominal variables in a contingency table with more than two rows or columns. It ranges from 0 (no association) to 1 (perfect association).
Concordance Correlation Coefficient (CCC): Lin's CCC measures the agreement between two sets of measurements. It is useful when comparing a new measurement technique against a "gold standard" or when comparing two measurement methods without a pre-existing gold standard.
Zero-Order Correlation: This refers to a simple correlation between two variables without controlling for the effects of any other variables. It's the most basic form of correlation analysis.
Understanding the Range and Interpretation
The correlation coefficient always falls within the range of -1 to +1.
- Positive Correlation (0 to +1): Indicates that as one variable increases, the other tends to increase. A value close to +1 signifies a strong positive linear relationship.
- Negative Correlation (-1 to 0): Indicates that as one variable increases, the other tends to decrease. A value close to -1 signifies a strong negative linear relationship.
- Zero Correlation (0): Indicates no linear relationship between the variables.
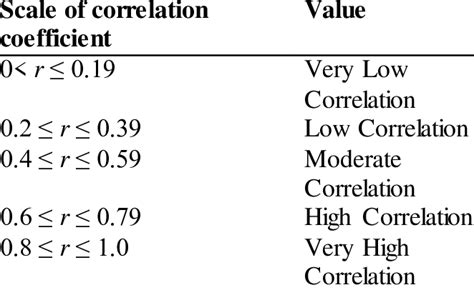
Interpreting the strength of a correlation coefficient often involves guidelines, though these can be context-dependent:
- 0.7 to 1.0 (or -0.7 to -1.0): Very strong relationship
- 0.4 to 0.69 (or -0.4 to -0.69): Strong relationship
- 0.2 to 0.39 (or -0.2 to -0.39): Moderate relationship
- 0.0 to 0.19 (or -0.0 to -0.19): Weak or no relationship
It is vital to remember that correlation does not imply causation. Just because two variables are strongly correlated does not mean that one causes the other. They might be influenced by a third, unmeasured variable, or the relationship might be coincidental. For example, ice cream sales and the number of drowning incidents might show a strong positive correlation because both increase during hot summer months, but one does not cause the other.
How Ice Cream Kills! Correlation vs. Causation
Practical Applications and Considerations
Correlation coefficients are widely used in various fields:
- Finance: Investors use correlation coefficients to assess how different assets move together, aiding in portfolio diversification and risk management. For instance, understanding the negative correlation between stocks and bonds can help build a more stable portfolio.
- Science: Researchers use correlation to explore relationships between biological factors, genetic variations, or environmental conditions. A study in China, for example, analyzed the Pearson's correlation between genetically different weedy rice populations to understand their evolutionary potential, finding positive correlations between 0.783 and 0.895.
- Social Sciences: Correlation helps in understanding relationships between socioeconomic factors, educational attainment, and behavioral patterns.
Limitations and Best Practices
Despite their utility, correlation coefficients have limitations:
- Linearity Assumption: Pearson's R, in particular, is designed for linear relationships. If the relationship is non-linear (e.g., curvilinear), Pearson's R may underestimate the true strength of the association.
- Outliers: Extreme values (outliers) can significantly distort correlation coefficients, making them appear stronger or weaker than they actually are.
- Range Restriction: Calculating a correlation coefficient over a restricted range of data can weaken the observed correlation.
- Causation Fallacy: The most critical limitation is the misinterpretation of correlation as causation.
To mitigate these issues:
- Always visualize data: Use scatter plots to check for linearity, outliers, and patterns before calculating correlation.
- Consider the context: Interpret correlation coefficients within the framework of the specific research question and discipline.
- Use appropriate coefficients: Select the correlation type that best suits the nature of your data (continuous, ordinal, binary, spatial, etc.).
- Statistical Significance: Beyond the coefficient value, consider the statistical significance (p-value) to determine if the observed correlation is likely due to chance or represents a genuine relationship in the population. A low p-value (typically < 0.05) suggests the correlation is statistically significant.
The Coefficient of Determination
Squaring a correlation coefficient (r²) yields the coefficient of determination. This value represents the proportion of the variance in one variable that is predictable from the other variable. A higher r² indicates that a larger portion of the variability in one variable can be explained by its linear relationship with the other. The remaining proportion, (1 - r²), is known as the coefficient of alienation, signifying the variance not shared between the two variables.
In essence, the correlation coefficient is a powerful yet nuanced statistical measure. When used correctly and interpreted cautiously, it provides invaluable insights into the relationships that shape our world.
tags: #what #is #corelation #coefficient