In the realm of statistics and data analysis, the terms "correlation" and "causation" are frequently encountered, often used interchangeably, leading to significant misunderstandings. While correlation indicates a statistical association between two variables, it does not inherently imply that one variable causes the other to change. Causation, on the other hand, signifies a direct cause-and-effect relationship where a change in one variable directly leads to a change in another. Recognizing this fundamental distinction is crucial for accurate data interpretation and informed decision-making across various fields.
The Nature of Correlation
Correlation tests explore the relationship between two variables, identifying patterns where their values tend to move together. This movement can be positive, meaning both variables increase or decrease simultaneously, or negative, where one variable increases as the other decreases. A correlation is quantified by a correlation coefficient, typically represented by the symbol 'r', which ranges from -1.0 to +1.0. A value of +1.0 indicates a perfect positive linear correlation, -1.0 signifies a perfect negative linear correlation, and 0 suggests no linear relationship between the variables.
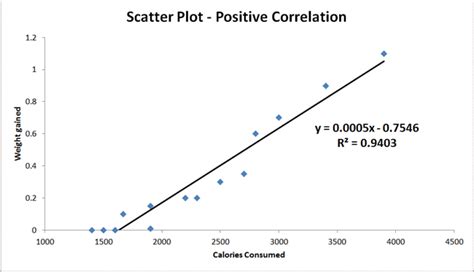
For instance, "hours worked" and "income earned" often exhibit a positive correlation: as more hours are dedicated to work, income tends to increase. Conversely, "price" and "purchasing power" demonstrate a negative correlation; as the price of goods rises, a person's ability to buy them typically decreases, assuming their income remains constant. This statistical measure is valuable for understanding the strength and direction of an association, allowing us to predict how one variable might change if another does.
However, it is vital to remember that correlation coefficients are primarily associated with measuring linear relationships. If the relationship between two variables is non-linear, the correlation coefficient might be closer to zero, even if a strong association exists. For example, a tradesperson charging an initial fee plus a decreasing hourly rate for longer jobs would present a non-linear relationship between hours worked and income, which a simple correlation coefficient might not fully capture.
The Pitfalls of Assuming Causation from Correlation
The common adage, "correlation does not imply causation," serves as a critical reminder against erroneously concluding a cause-and-effect link solely based on an observed association. This fallacy, known as "cum hoc ergo propter hoc" (with this, therefore because of this), is prevalent when people observe two variables moving together and assume one is the direct cause of the other's change.
A classic illustration involves the observed correlation between ice cream sales and forest fires. Both tend to increase during hot summer months. However, the purchase of ice cream does not cause forest fires, nor do forest fires cause people to buy ice cream. Instead, a third variable-hot weather-independently influences both phenomena. People are more likely to buy ice cream when it's hot, and hot, dry conditions increase the risk of forest fires.
Another illustrative example from health data might reveal a statistically significant positive correlation between exercise and skin cancer rates. Without further investigation, one might wrongly conclude that exercise causes cancer. The reality could be that individuals who live in sunnier climates engage in more outdoor recreation, leading to increased exercise, and simultaneously experience higher exposure to UV radiation, thus increasing their risk of skin cancer. In this scenario, sunlight exposure is the confounding variable.
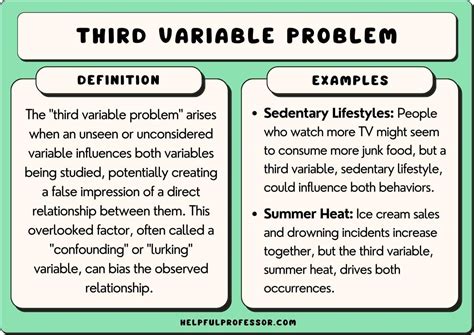
The "third variable problem," also known as a confounding variable, is a primary reason why correlation does not imply causation. A confounding variable is an unobserved factor that influences both of the variables being studied, creating a spurious correlation. This hidden variable affects both observed variables independently, making them appear causally linked when they are not.
Furthermore, the "directionality problem" arises when two variables are correlated, and a causal relationship might exist, but it's unclear which variable is the cause and which is the effect. For example, a correlation between recreational drug use and psychiatric disorders could mean that drug use leads to disorders, or that individuals with pre-existing disorders turn to drugs for self-medication. This ambiguity is particularly challenging in social sciences where controlled experiments are often difficult or unethical to conduct.
Establishing Causation: Methods and Challenges
Determining causality is a more rigorous process than establishing correlation. It requires demonstrating a direct link where a change in one variable brings about a change in another. While correlation can be identified through observational data, establishing causation often necessitates experimental designs or advanced statistical techniques that can isolate the effect of one variable on another.
Controlled Experiments and Randomization
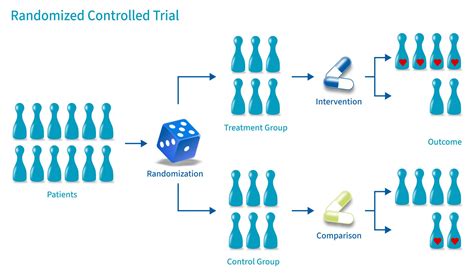
The most effective method for establishing causality is the controlled experiment. In such studies, a sample or population is divided into at least two groups that are as comparable as possible. One group, the experimental group, receives a specific treatment or intervention, while the other, the control group, does not, or receives a placebo. By comparing the outcomes of both groups, researchers can infer whether the intervention caused any observed differences.
Randomization is a key component of controlled experiments. Randomly assigning participants to different groups helps ensure that any pre-existing differences between individuals are distributed evenly across the groups. This minimizes the likelihood that other factors, rather than the intervention itself, are responsible for the observed outcomes. For example, if researchers wanted to test the causal link between exercise and skin cancer, they could randomly assign a large group of people to either an indoor exercise program or a control group for several years, meticulously controlling for other variables.
Observational Studies and Statistical Techniques
While controlled experiments are the gold standard, they are not always feasible due to ethical, practical, or cost constraints. In such cases, observational studies are employed, where researchers observe and collect data on variables without manipulating them. Correlational research, as discussed, is a type of observational study.
To infer causality from observational data, researchers often use advanced statistical techniques. These include:
- Predictive Models with Multiple Variables: Building models that account for numerous variables can help isolate the impact of a specific variable by controlling for the influence of others.
- Granger Causality Test: This statistical hypothesis test determines whether one time series is useful in forecasting another. It's based on the idea that if a variable X "Granger-causes" variable Y, then past values of X should contain information that helps predict Y. However, it's important to note that Granger causality is a statistical concept and not necessarily true causality.
- Bradford Hill Criteria: Developed by epidemiologist Sir Austin Bradford Hill, these are a set of nine criteria used to assess the likelihood of a causal relationship between an exposure and a disease. They include strength of association, consistency, specificity, temporality, biological gradient, plausibility, coherence, experiment, and analogy. These criteria are not a checklist but rather a framework for evaluating evidence.

The Role of Theoretical Plausibility and Mechanism
Beyond statistical associations, understanding the underlying mechanism through which one variable might influence another is crucial for establishing causality. For instance, finding a negative correlation between exercise and heart disease is suggestive, but understanding the physiological pathways-such as exercise improving blood pressure through nitric oxide production-provides stronger evidence for a causal link. This is akin to Mill's methods of induction, which emphasize observing phenomena apart from others to understand their specific effects.
Common Misconceptions and Spurious Correlations
The allure of simple explanations can lead to the acceptance of spurious correlations, which are relationships that appear statistically significant but are purely coincidental. The more variables one examines in a large dataset, the higher the probability of finding such chance associations.
A famous example of a spurious correlation is the observed relationship between the population of storks and the birth rate in Germany and Denmark. Over decades, as stork populations fluctuated, so did the number of newborns. The "Theory of the Stork" humorously suggested that storks deliver babies. In reality, this correlation is likely due to a common underlying factor: rural areas with more storks also historically had higher birth rates due to socioeconomic factors.
8.3 - Spurious Correlation
Another example is the perceived link between sleeping with shoes on and experiencing headaches. While a correlation might be observed, the actual cause is more likely to be a third factor, such as consuming alcohol before bed, which can lead to both falling asleep with shoes on and experiencing a headache the next day.
Correlation and Causation in Scientific Inquiry
Despite the challenges, correlation plays an indispensable role in scientific discovery. It serves as an initial indicator, prompting further investigation into potential causal relationships. Social workers, for instance, might observe a correlation between child abuse and poor academic performance. While it would be unethical to experimentally induce abuse, correlational studies can highlight this association, guiding interventions and support systems.
The tobacco industry historically attempted to dismiss the strong correlational evidence linking smoking to lung cancer by emphasizing that correlation does not imply causation. This strategy aimed to sow doubt and delay regulatory action. However, a combination of extensive correlational data, biological plausibility (identifying carcinogens in smoke), and experimental evidence has since firmly established the causal link.
In essence, correlation is a starting point, a signal that warrants deeper exploration. Causation requires a more robust demonstration, often involving controlled experiments or sophisticated analytical methods to rule out alternative explanations. By understanding the nuances between these two concepts, we can navigate data more effectively, draw more accurate conclusions, and make more informed decisions in both our personal and professional lives.
tags: #corelation #and #causation